Why day traders lose money
Retail day trading is a negative-expected-value activity for the average participant. The reasons are structural and measurable, which is why the failure rate barely moves across countries, decades and asset classes.
The six forces
- Costs on every round trip. Spreads, commissions, slippage, financing on leverage and short-borrow fees are charged regardless of outcome.
- Adverse selection. The counterparty is usually a market maker or high-frequency firm with superior data, latency and cost structure.
- Leverage. It amplifies fees and noise, not edge. A negative expectancy leveraged is simply a faster negative expectancy.
- Taxes. Short-term gains attract the highest marginal rate in most jurisdictions, so even a winning year keeps less.
- Cognitive biases. Loss aversion, the disposition effect and overconfidence all push trading frequency up.
- Survivorship bias. The visible winners on social media are a filtered sample; the losers go quiet or start selling courses.
Why more practice does not fix it
Skill acquisition requires fast, unambiguous feedback. Market outcomes are dominated by noise over short horizons, so a trader cannot reliably tell a good decision from a lucky one for months. Meanwhile the cost drag compounds every session. That combination — slow, noisy feedback plus a constant fee — is what turns effort into loss rather than mastery.
What the evidence shows
Roughly 97-99% of retail day traders lose money net of costs over multi-year horizons, and 70-85% of EU/UK CFD accounts lose money each quarter. See the full statistics for the underlying studies.
What the long-run studies actually found
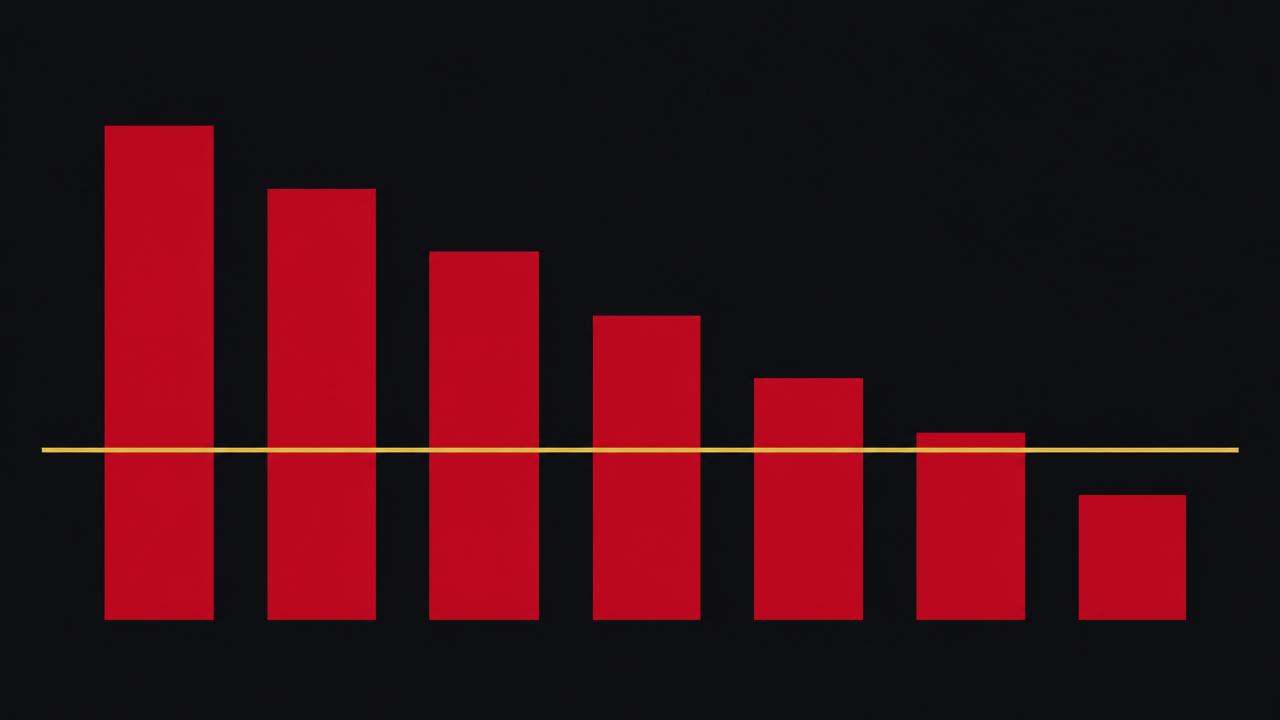
Five independent datasets, four countries and three decades point the same way: the share of retail day traders who make money after costs is small, and the share who make a living from it is smaller still. These are audited account records, not surveys or self-reported returns.
| Study or source | Sample | Headline finding |
|---|---|---|
| Barber, Lee, Liu & Odean | Taiwan, 1992-2006 | Under 1% of day traders earned reliably positive net profits; the top 500 covered their costs, everyone else funded them. |
| Chague, De-Losso & Giovannetti | Brazil, 2013-2015 (1,600 traders) | 3% were profitable and only 0.4% earned more than a bank teller. None who persisted improved with experience. |
| Barber & Odean, Trading Is Hazardous to Your Wealth | USA, 66,465 households | The most active fifth of accounts underperformed the market by about 6.5 percentage points a year. |
| ESMA and national regulators | EU/UK retail CFD accounts | 74-89% of retail CFD accounts lose money — a figure brokers are legally required to publish. |
| Jordan & Diltz | USA, 324 day traders | About 20% finished profitable over the period; losses were concentrated among the least experienced. |
Where the money actually goes
Before a trader beats the market, they must beat their own cost base. Every round trip pays a spread, usually a commission, and some slippage. At a realistic $8 per round trip, cost drag alone can exceed the entire account within a year.

| Trader profile | Round trips per year | Annual cost | Share of a $25,000 account |
|---|---|---|---|
| Casual — 5 trades a week | 260 | $2,080 | 8% |
| Active — 5 trades a day | 1,250 | $10,000 | 40% |
| Very active — 20 trades a day | 5,000 | $40,000 | 160% |
| Scalper — 50 trades a day | 12,500 | $100,000 | 400% |
Key terms, defined
- Day trading
- Opening and closing a position in the same instrument within one trading session, aiming to profit from short-term price movement.
- Spread
- The gap between the buy and sell price. It is an immediate, guaranteed loss at the moment a position opens.
- Leverage
- Borrowed exposure that multiplies both gains and losses. It shortens the time to ruin far more than it raises expected return.
- Slippage
- The difference between the expected fill price and the actual one, largest exactly when volatility makes trading look most attractive.
- Drawdown
- The fall from an account's peak to its trough. A 50% drawdown requires a 100% gain to recover.
- Expected value
- The average outcome of a strategy repeated many times. For retail day trading, it is negative after costs.
Frequently asked questions
Do day traders lose money because of bad strategy?
Rarely. The dominant factors are cost drag, leverage and counterparty quality, which affect every strategy equally. Changing strategy does not change the cost structure.
Can better risk management fix it?
Risk management reduces the speed of loss, not its expected direction. It helps a positive-expectancy trader survive; it cannot make a negative-expectancy one profitable.
Why do some traders appear consistently profitable online?
Most public track records are unverified, and social platforms only surface winners. Verified, cost-inclusive multi-year records are extremely rare.
Can day trading be learned with enough practice?
The Brazilian futures study followed traders day by day and found no improvement with experience: persistence increased losses rather than skill. Unlike chess or surgery, markets give noisy, delayed feedback, so practice does not reliably build expertise.
Do courses, signals or prop-firm challenges improve the odds?
There is no published evidence that paid education changes outcomes. Course fees, subscription costs and challenge fees are additional guaranteed costs added on top of an already negative expected value.
What is a realistic annual return for a retail day trader?
For the large majority it is negative after costs and taxes. A diversified index fund returned roughly 7-10% a year on average over long periods, with no screen time and far lower cost.
Read the whole argument
Day Trading Kills devotes several chapters to each of these forces, with the underlying research.